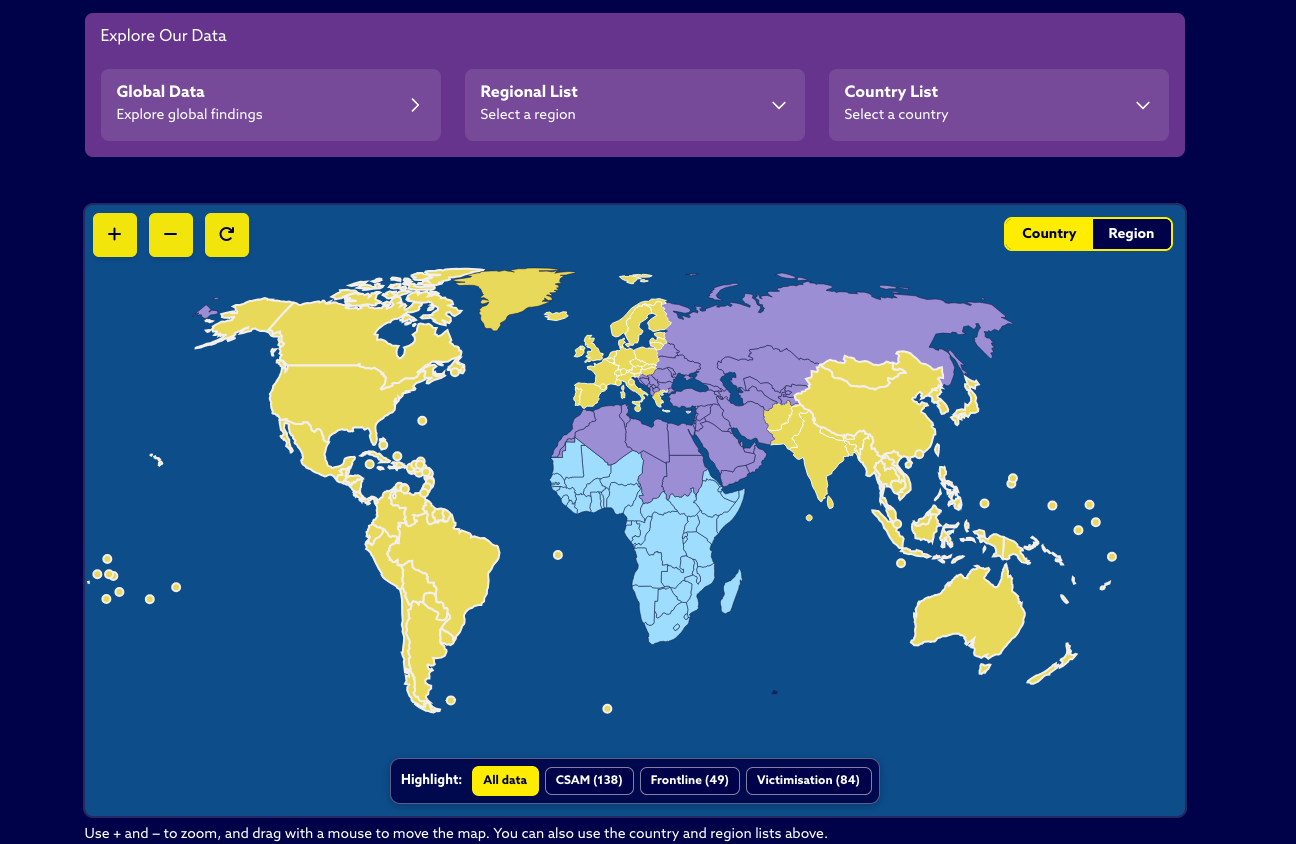
Explore data and analysis on child sexual exploitation and abuse (CSEA) at country, regional and global levels. The dashboard brings together findings from the 2025 and 2026 Index releases. The available data areas, indicators and reporting years vary between countries and regions.
The screenshots below illustrate the controls; use the dashboard itself to select options. All instructions are also provided in the text.
Under Explore Our Data on the dashboard home page, select a country or region from the lists, or choose Global Data to explore global findings. These options also work on a mobile phone and provide an alternative to using the map.
On larger screens, you can also select a country on the map and follow the available country, regional or global data links. Use the map’s + and − buttons to zoom, and drag with a mouse to move around. The highlight buttons help identify where data are available for CSAM, Frontline or Victimisation; they do not change the underlying figures.
The Index release year and the year represented by a figure are different. A 2026 Index page may contain data collected or reported over several earlier years. Check each chart’s title, year labels, notes and references before interpreting the results. Where year buttons are available, select a year to change the figures displayed.
Country pages from the 2025 Index may look different from those published in 2026, which include additional data. The links to the Technical Note, Data References and Supplemental Thematic Analysis Report on each country page relate to that year’s Index. To find earlier publications, select Previous Index Data and Related Resources on the home page.
Choose a data area, then use its tabs to explore the available findings. Regional pages show the areas available for that region. The global view currently presents CSAM findings; not every country or regional indicator has a global equivalent.
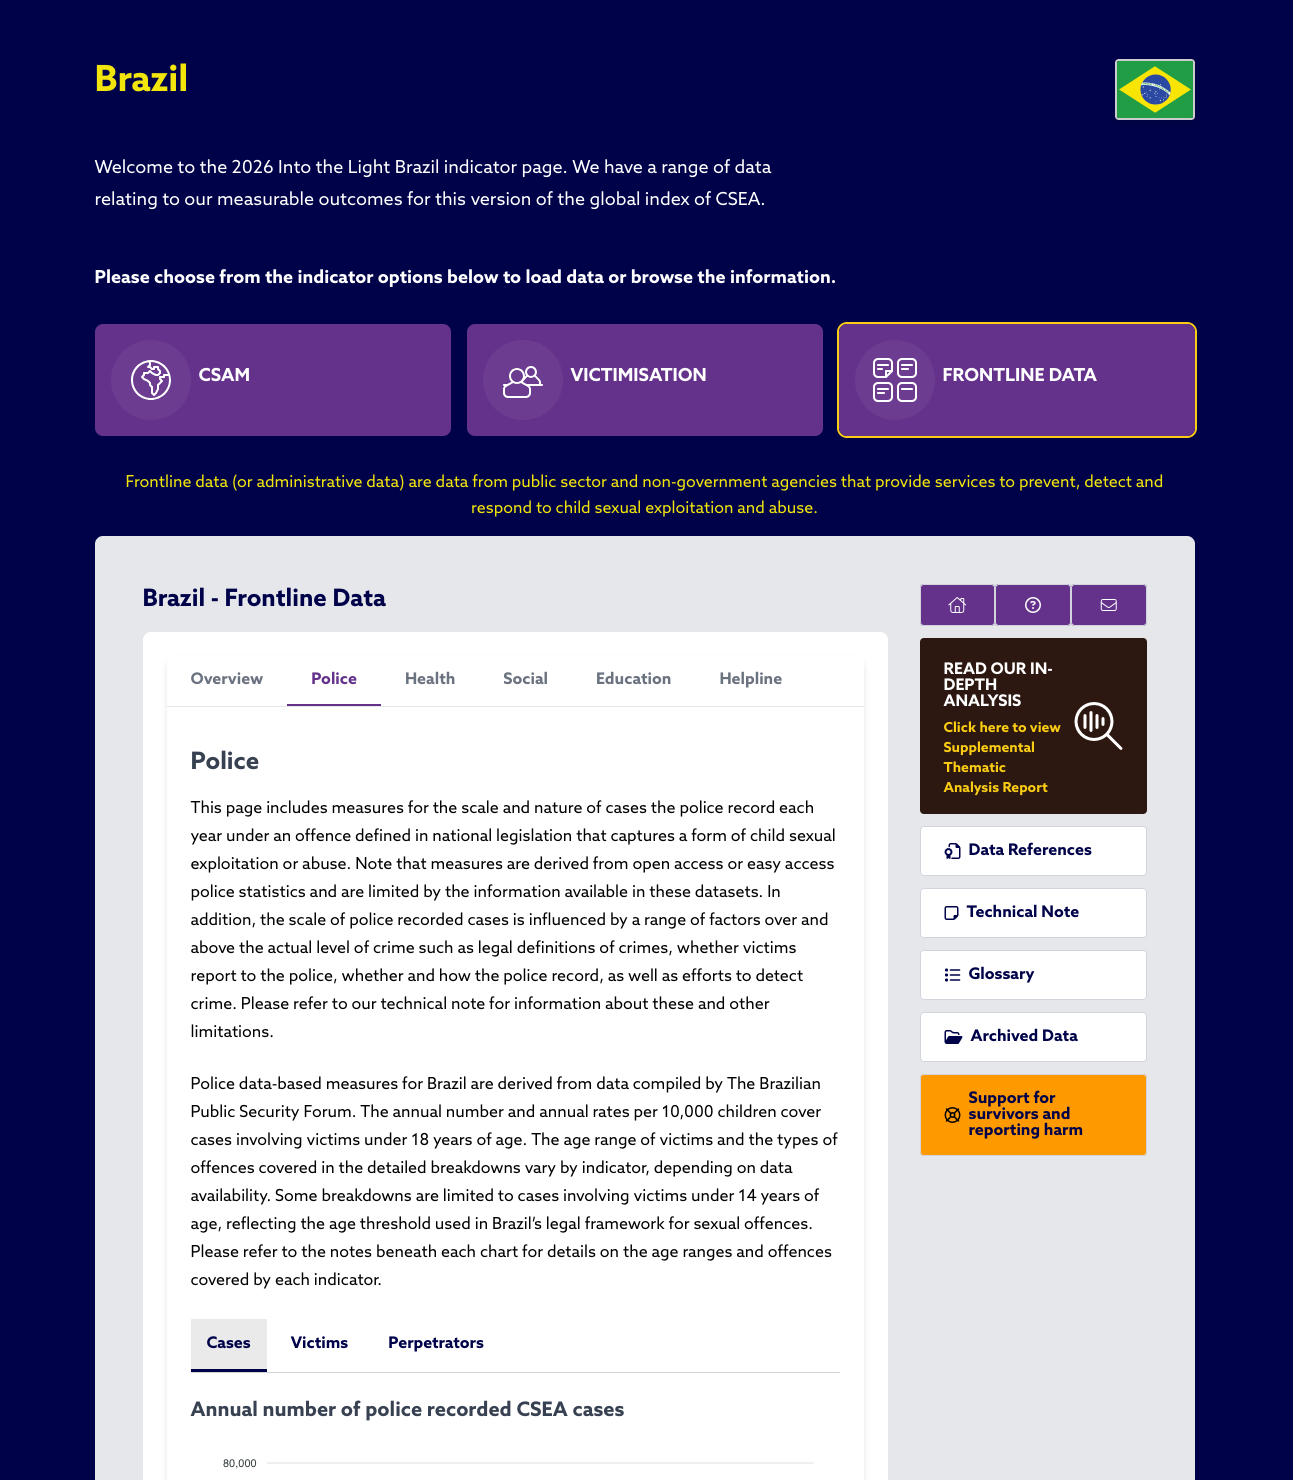
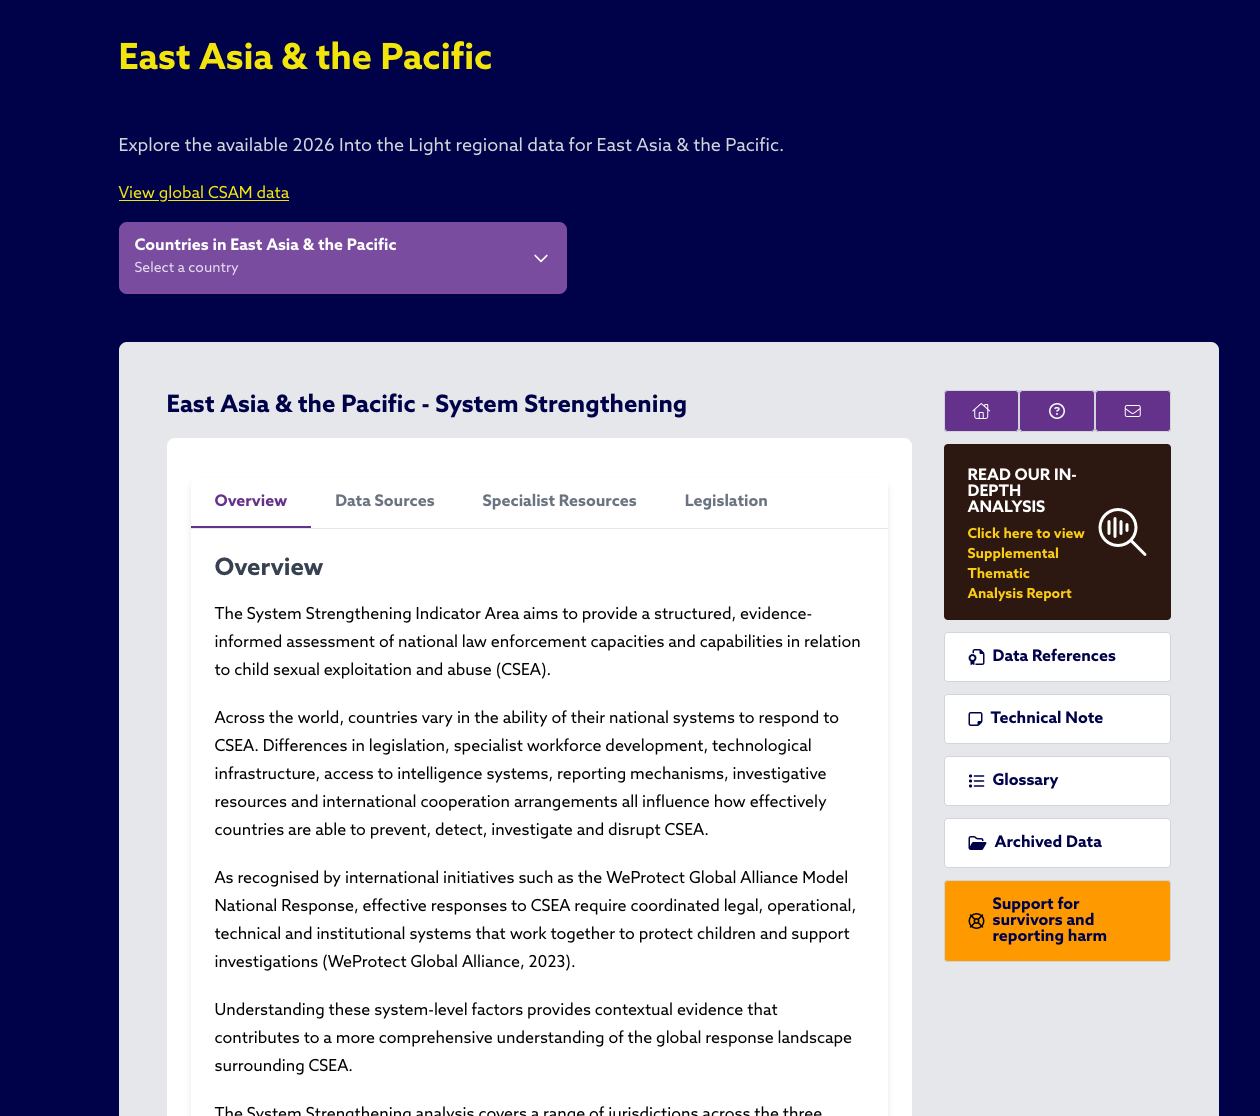
Read the introductory text and chart notes as well as the figures. Check whether a chart shows a number of cases, a rate or a percentage, and which population and categories it covers. Frontline records describe cases known to services and should not be interpreted as a count of all CSEA occurring in a country.
Multi-year charts show changes or category breakdowns across reporting years. Some single-year breakdowns use horizontal bars. A gap or an unavailable-data message does not mean there were zero cases. Definitions, sources and coverage can differ, so consult the Technical Note before comparing countries, services or years.
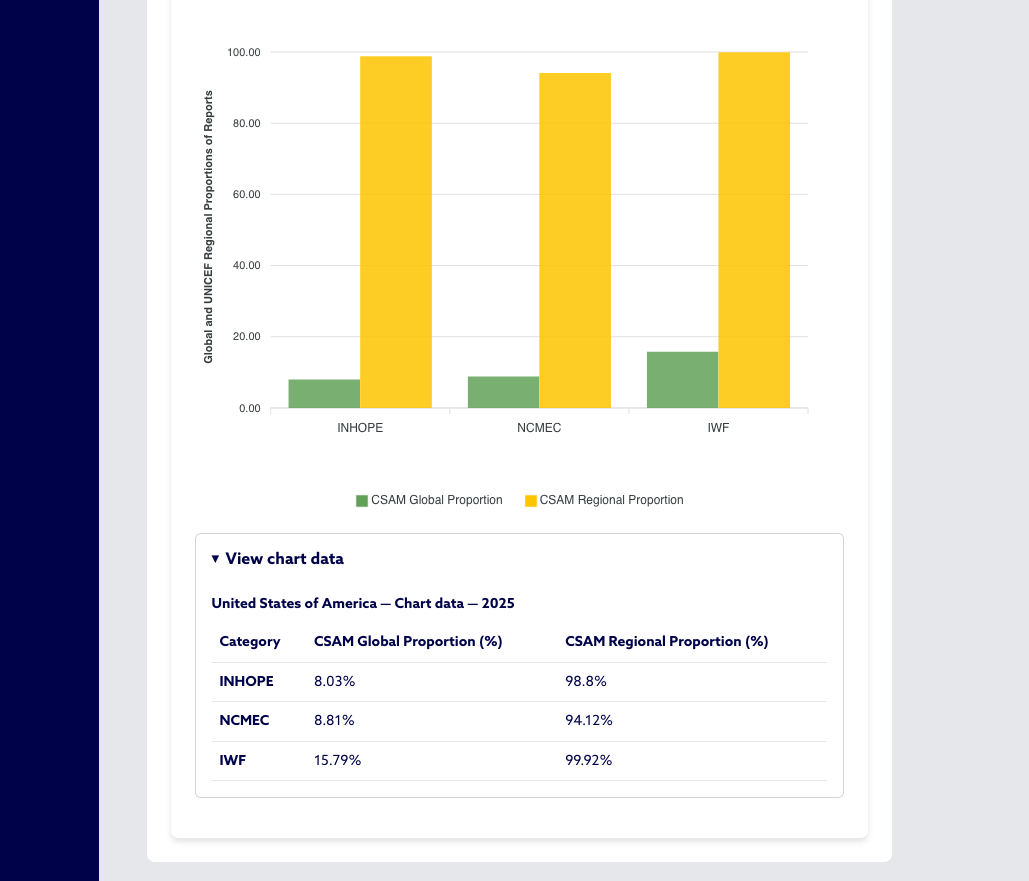
Select View chart data beneath a chart to expand its data table. Tables provide a text alternative to the visual chart, including category names and values, and can be read using assistive technology. Select the control again to collapse the table.
On a phone or smaller screen, use the country and region lists to navigate. Some detailed charts or tables may require horizontal scrolling within their own area. The chart data table provides another way to read exact values without relying on chart colours or hovering over bars.
Select Accessibility Tools on the website to open the Recite Me toolbar. Use your mouse or trackpad to explore its reading, language and display options.
You can also navigate the dashboard using your keyboard. Press Tab to move between buttons, links and other controls. Use the Left and Right arrow keys to move between tabs in a group. Press Enter to select or open the focused item, and Escape to close an open dashboard dialog.
To try translating a PDF on the Childlight website, open Accessibility Tools and choose your language before opening the PDF. If the PDF opens with the Recite Me toolbar and the text is still in English, select your language again in the PDF toolbar.
If the toolbar is unavailable, including on some external sites and in downloaded copies, check the tools in your browser or PDF reader. You can also read the main findings on the Executive Summary web page with the Childlight toolbar.
Depending on the publication and your browser settings, a PDF may open in your browser or download.
Use Get in Touch on the home page or the contact button on a data page if you have questions, encounter difficulties or would like to suggest additional data. Select Support for Survivors and Reporting Harm for support information. Use the home button on a data page to return to the dashboard home page.